Manufacturing
The Manufacturing Economic Update
Dr. Chad Moutray
Chief Economist - National Association of Manufactures
Director, Center for Manufacturing Research - The Manufacturing Institute
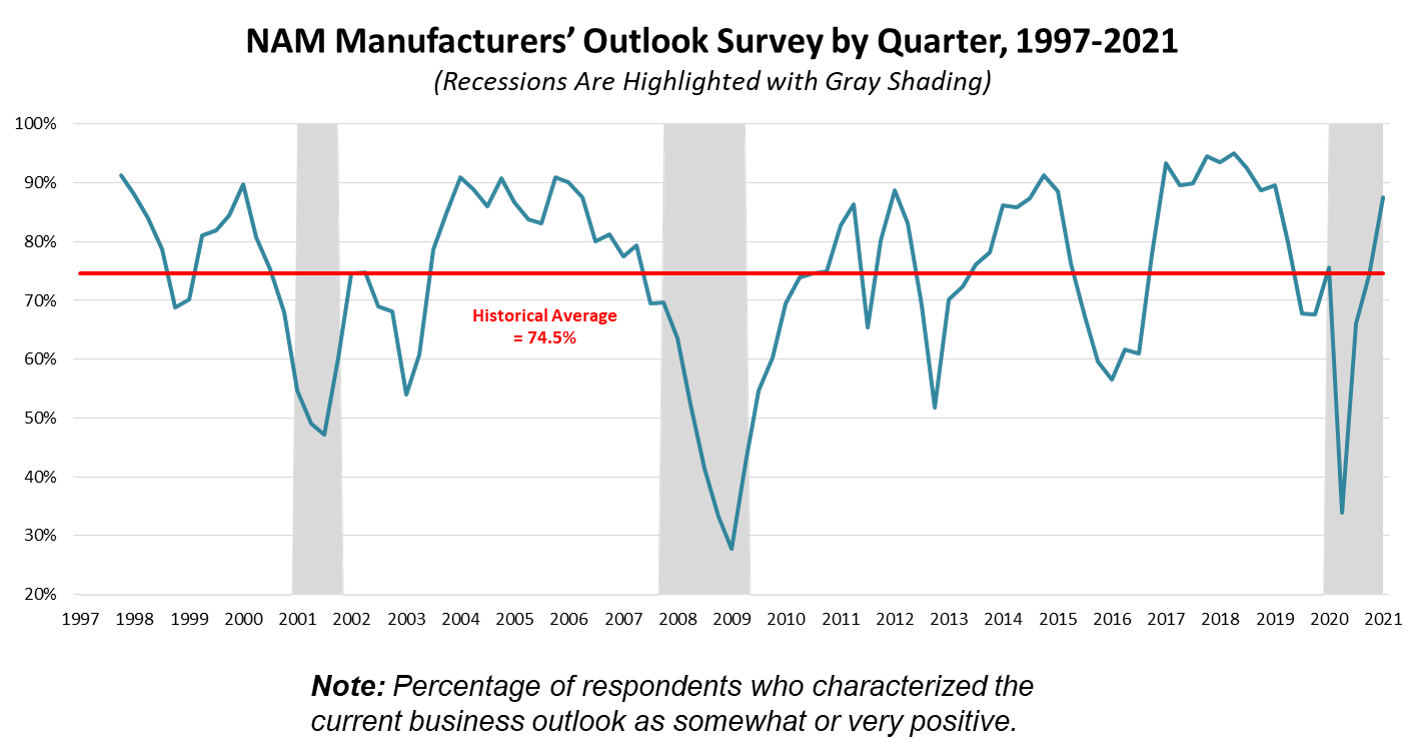
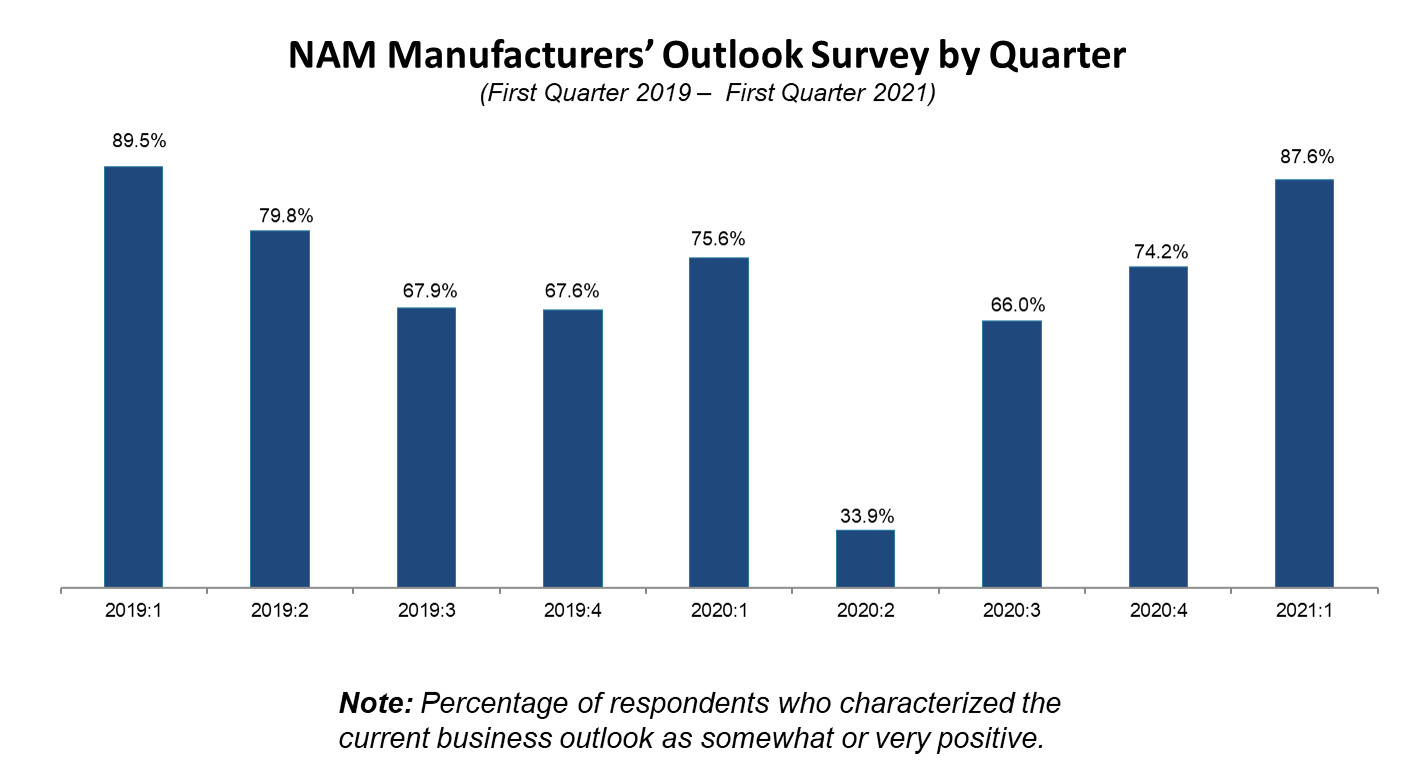
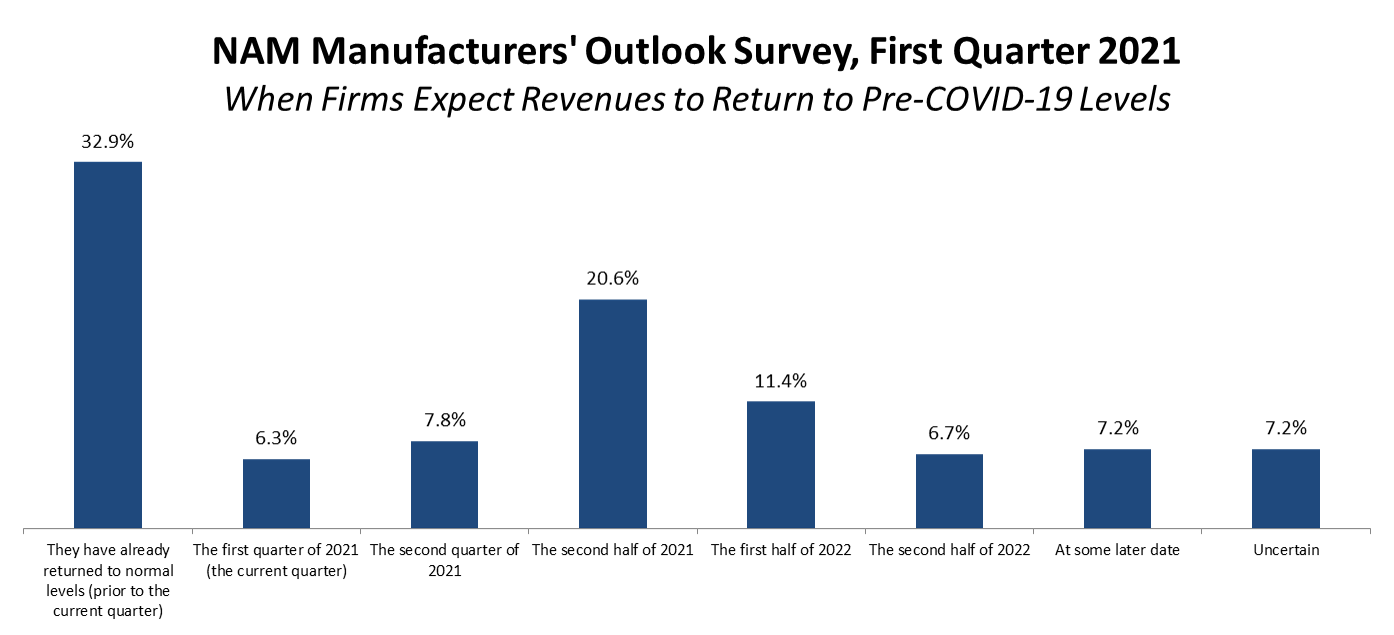
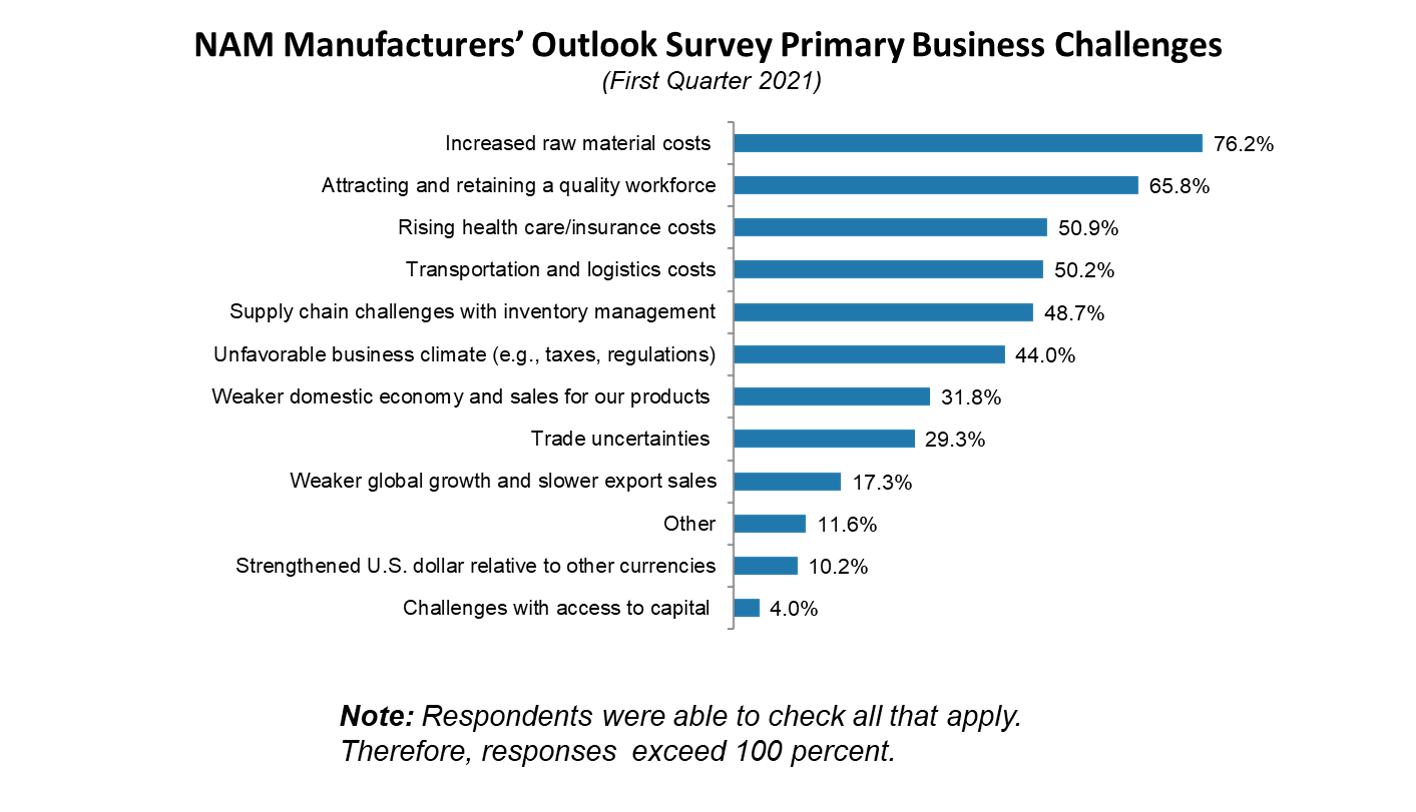
NAM Manufacturing Outlook Survey - 1st QTR 2021
NAM Manufacturing Outlook Survey - 2nd QTR 2021
NAM Manufacturing Outlook Survey - 3rd QTR 2021
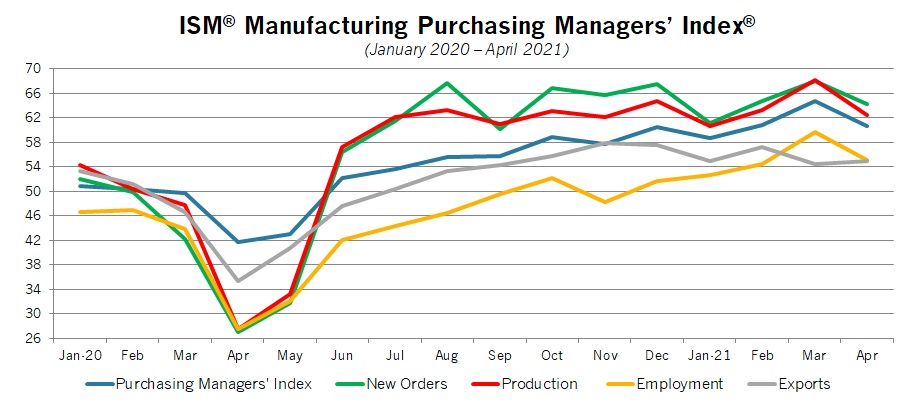 After expanding in March at the fastest pace since December 1983, the @ism reported that manufacturing activity eased a bit in April, but with growth continuing to be robust overall. The headline index pulled back from 64.7 in March to 60.7 in April.
Trade-Weighted U.S. Dollar Index Against Broad Index of Currencies, Goods and Services, 2014–2020
(Currency Units per U.S. Dollar, January 2006=100)
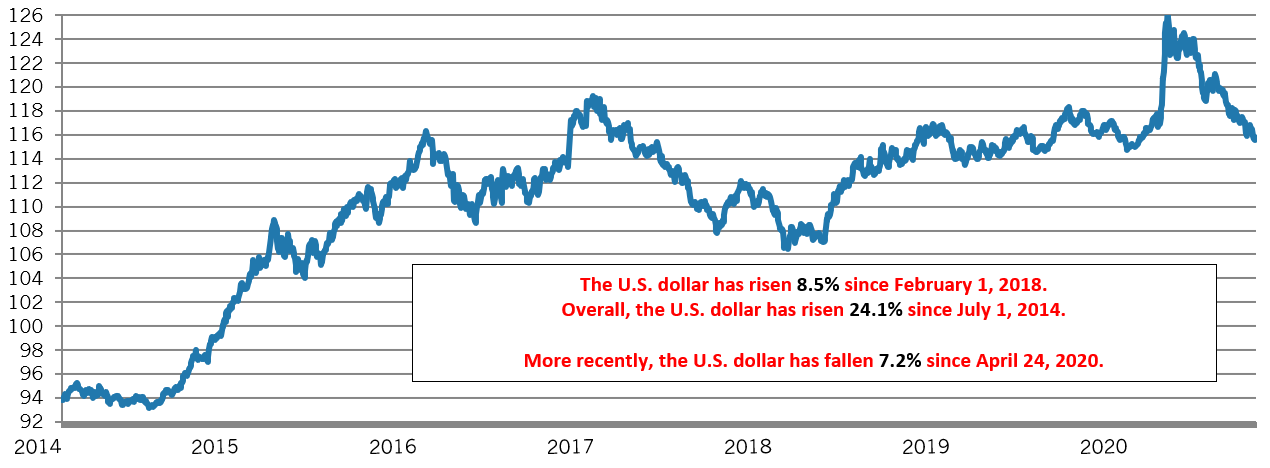
Source: Federal Reserve Board